Income inequality has been on the rise in the US, and the
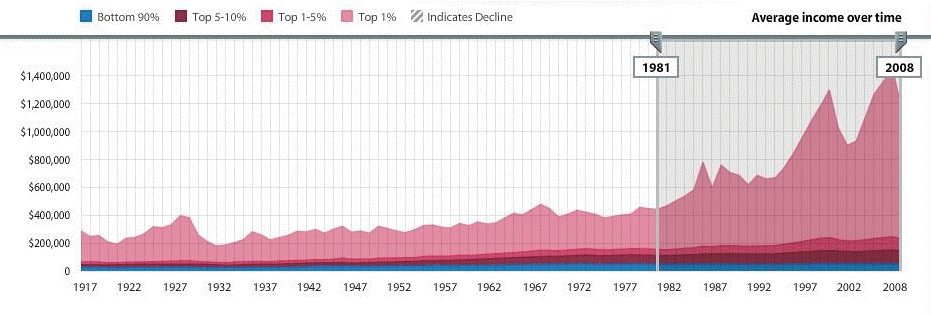
middle class is shrinking. The following chart shows income equality grew
before the Great Depression but was stable, and the middle class grew after the
Depression until something happened in 1981. Compare this chart to the Income
Tax Rate chart to discern a possible cause.

The effect of government programs on
income distribution is indisputable. But
it is certainly not the only factor at work. In recent years international
competition by labor for jobs has intensified. Competition has reduced the
effectiveness of labor organization. Technology has dramatically improved
productivity and reduced the demand for labor and allowed labor to be replaced
with automation (i.e. capital). These factors have restricted the growth of
real median personal income in the US to just 10% in the past 20 years. And
this has occurred even while business has been highly profitable, rewarding top
management, owners and those with capital. In the US the federal income tax is
the most progressive tax among the five largest revenue producing taxes
(federal and state income, payroll, sales, and property) so it would be tool of
choice if the government wanted to regulate the income distribution.
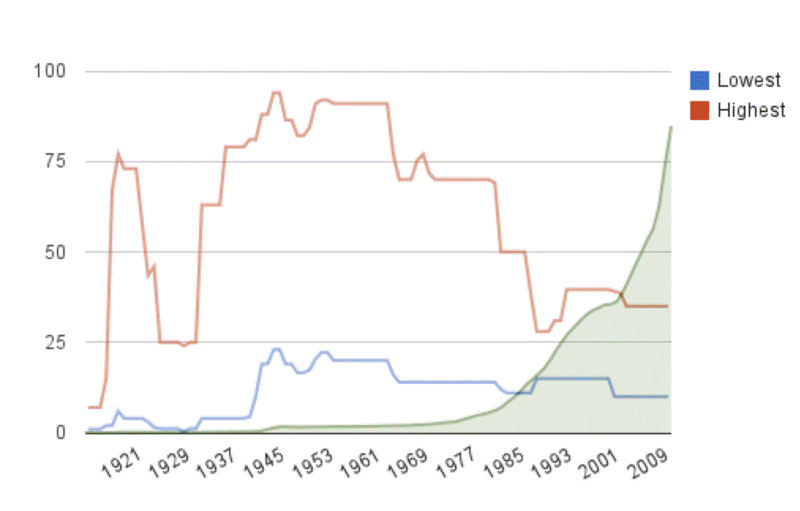
The following chart shows the income
tax has not been used to redistribute wealth from the rich to the poor. Since 1969 the highest tax rates have been
steadily reduced to rates last experienced in the 1920’s. In addition to these
marginal rates, the treatment of dividends and capital gains has been made even
more favorable.
Income Tax rates:

From WWII until 1981 the US middle class grew steadily and
income inequality steadily decreased in America. Since 1981 macro-economic
factors and government policy have increased US income inequality. Wealth has
been steadily concentrating in the hands of the wealthiest.
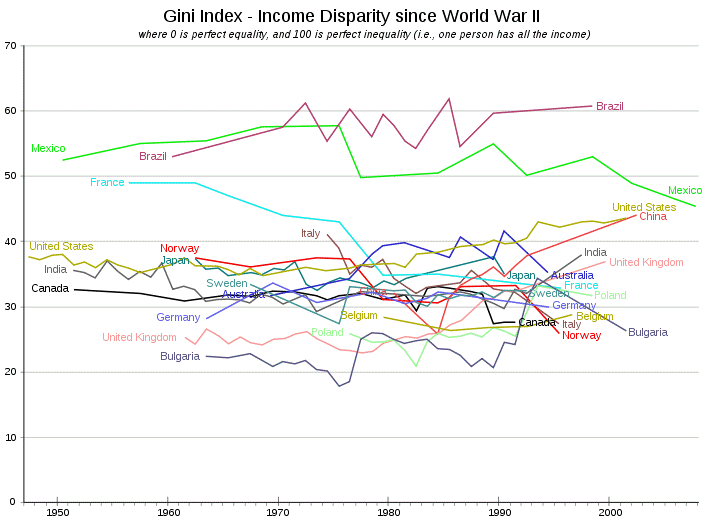
The Gini coefficient measures income disparity and shows income
inequality in the US is now the highest among OECD countries, except Mexico and
Chile. The US Gini has not been this high since 1929. The $56T in tangible US wealth,
if divided equally (a Gini index of 0) would provide $170,000 for every American
man, woman and child. The $15T GDP would provide $80,000/year income for every
member of the workforce. Divided as it is, the top 1% control 40% of the income
and wealth, the top 10% controls 80%. Nearly 50% of Americans have no financial
wealth (savings) at all. The $7.25/hour minimum wage provides a floor under
$15,000/year for full time employment. The average nonfarm wage of $22.45/hour
provides a median $45,000/year income for the 157 million adults able to find a
job.

Government redistributes wealth through taxation and
transfer payments. Since Reagan, taxes have
become more regressive. The Republicans have been pursuing a theory of “trickle
down or supply side” economics. Top income tax rates have dropped to all-time
lows while payroll and sales taxes have grown. The net effect is that the Tax
System in the US is now very flat with everyone paying 28-33% of their income
in taxes. The chart shows for different annual earnings what the expected
percentage of that income goes to various federal, state and local taxes.
2009 Tax Summary | | | | 106 | | | | |
| Sales | Prop | St Inc | Fed Inc | FICA | Med | | Total |
Earn | | | | | | | | |
0-50,000 | 6.0% | 3.0% | 1.0% | 3.0% | 12.4% | 2.9% | | 28.3% |
50-75,000 | 3.7% | 3.0% | 2.0% | 7.0% | 12.4% | 2.9% | | 31.0% |
75-100,000 | 3.7% | 3.0% | 2.6% | 8.0% | 12.4% | 2.6% | | 32.3% |
100-200,000 | 2.8% | 2.9% | 3.1% | 12.0% | 9.7% | 2.2% | | 32.7% |
200-500,000 | 1.7% | 2.4% | 3.6% | 19.0% | 4.9% | 1.9% | | 33.5% |
500,000 up | 0.9% | 1.4% | 4.2% | 24.0% | 1.3% | 1.5% | | 33.3% |
| | | | | | | | | |
Fed Inc Tax 2009, 140 million return, IRS.gov | | | | | |
State and Local Taxes from Institute of Taxation and
Economic Policy , Who Pays, 2009 |
A controversial 2012 Congressional Research Service Report
contained the following conclusion:
The
top income tax rates have changed considerably since the end of World War II.
Throughout the late-1940s and 1950s, the top marginal tax rate was typically
above 90%; today it is 35%. Additionally, the top capital gains tax rate was
25% in the 1950s and 1960s, 35% in the 1970s; today it is 15%. The average tax
rate faced by the top 0.01% of taxpayers was above 40% until the mid-1980s;
today it is below 25%. Tax rates affecting taxpayers at the top of the income
distribution are currently at their lowest levels since the end of the Second World
War
The
results of the analysis suggest that changes over the past 65 years in the top
marginal tax rate and the top capital gains tax rate do not appear correlated
with economic growth. The reduction in the top tax rates appears to be
uncorrelated with saving, investment, and productivity growth. The top tax
rates appear to have little or no relation to the size of the economic pie.
However,
the top tax rate reductions appear to be associated with the increasing
concentration of income at the top of the income distribution. As measured by
IRS data, the share of income accruing to the top 0.1% of U.S. families
increased from 4.2% in 1945 to 12.3% by 2007 before falling to 9.2% due to the
2007-2009 recession. At the same time, the average tax rate paid by the top
0.1% fell from over 50% in 1945 to about 25% in 2009. Tax policy could have a
relation to how the economic pie is sliced—lower top tax rates may be
associated with greater income disparities.